
Here is a good example of presenting data, a task that can be no easy challenge for many. Even more so when it comes to socio-economic aggregates where it can be difficult for the public to visualize them. We need to find the right balance of data. Too few can undermine credibility, especially on controversial topics. Too many and the risk is to confuse or even bore the public.
Numbers are nothing. Certainly not in mathematics, but often in communication.A dataset has no intrinsic value. What matters is the message it contains. An effective speaker has the ability to convey “that message” using supporting data as a credible and objective basis.
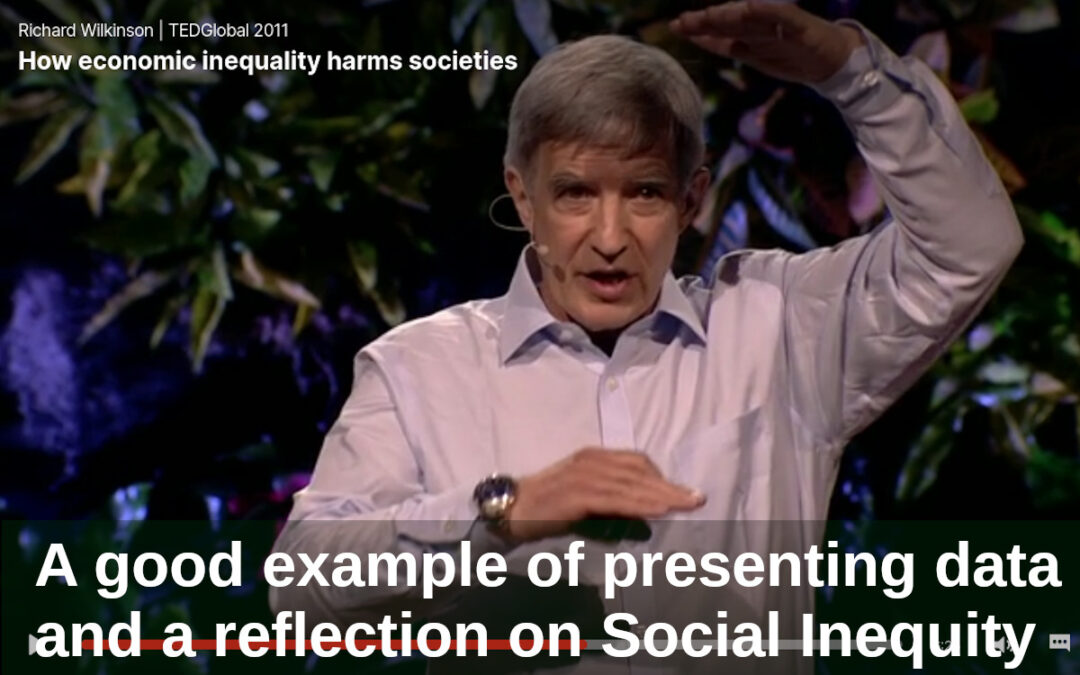
A good example is this presentation by Richard Wilkinson that I recommend you take a look at because it is particularly interesting.
The theme is how economic inequity affects the quality of life, health and even certain factors such as people’s trust. It is not an easy topic, potentially controversial and therefore challenging to deal with. Wilkinson manages to get the message across while maintaining public interest and credibility.
To do this it uses different data and it is useful for us to note some aspects.
One of the potential risks of these kinds of presentations is that the audience thinks they are subjective rather than objective topics. Some research is sometimes biased. In other cases there are simultaneously conflicting ones and still some are sensationally confuted over time (do chocolate and cavities teach anything?). Wilkinson knows this and is the first to recognize it, to bring out this potential public scepticism: he does not ignore it. On the contrary, he takes care to point it out and validate his thesis by clearly explaining how the most rigorous precautions have been taken to give scientific credibility to what he presents.
This means that it must bring a lot of data to support it to demonstrate that it is not a matter of chance but a consistent and real phenomenon both through geographies and through different indicators. The secret is to keep a good pace so as not to get bored and just extract the main idea from each research. Say what is enough without getting lost in unnecessary details for the purpose of the exposition.
Finally, a trick of the director who in some cases enlarges a graph, eliminating the axes and legends, to make it more readable. I don’t think it was an effect originally inserted in the presentation but it could be an inspiration for our charts when difficult to visualize. First show them briefly in their entirety and then zoom in on the salient part.
If you haven’t watched the video above yet, I recommend you do it now.
Recent Comments